NUMERICAL REASONING TEST

In this test you will be using facts and figures present in various statistical tables to answer questions designed to assess your ability to evaluate numerical data.

In each question you are given either five or ten options to choose from. One, and only one, of the options is correct in each case.

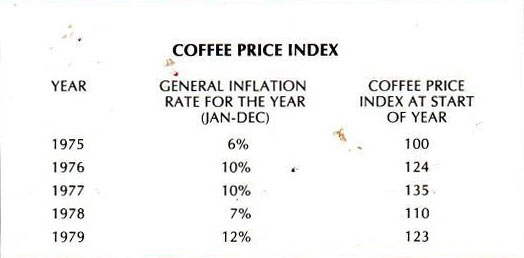
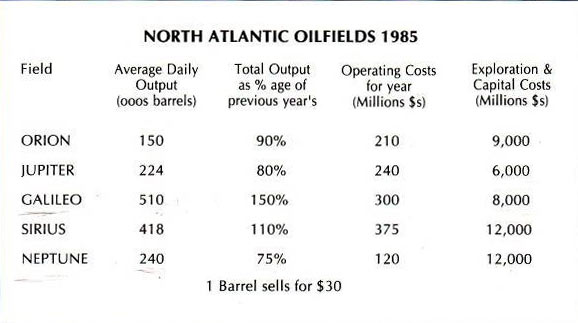
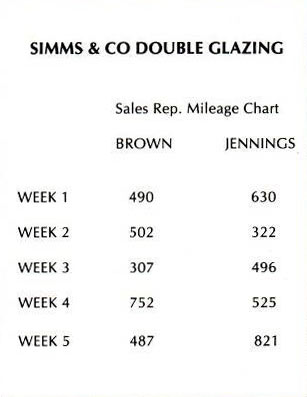
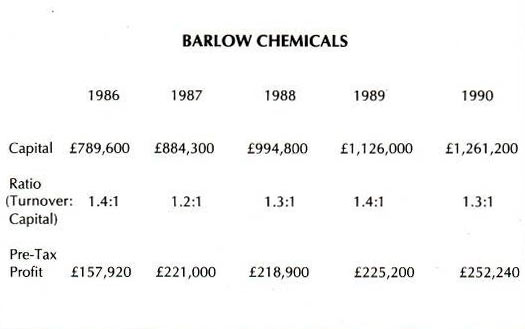
Please refer to the statistics tables below in order to correctly answer each question.

1. What proportion of Devondale Orchards’ total production in 1985 was accounted for by pears?

A. 20%
B. 25%
C. 30%
D. 35%
E. 40%
AB. 45%
AC. 50%
AD. 55%
BC. 65%

2. Which category of professional associates had the greatest ratio of non-graduate to graduate new admissions in 1984?

A. Accountancy & Law
B. Engineering
C. Science & Technology
D. Others (Commercial)
E. Others (Technical)

3. Between which two weeks was there the greatest proportional increase or decrease in Brown’s mileage, relative to the previous week?

A. Weeks 1-2
B. Weeks 2-3
C. Weeks 3-4
D. Weeks 4-5
E. Cannot say

4. What was the approximate pre-tax profit of Barlow Chemicals as a percentage of turnover in 1990?

A. 1%
B. 5%
C. 8%
D. 11%
E. 15%
AB. 19%
AC. 23%
AD. 28%
AE. 32%
BC. Cannot Say

5. What proportion of the total populations of the 4 tourist nations shown was equivalent to the number visiting Italy in 1981?

A. 0.1%
B. 02%
C. 0.3%
D. 0.4%
E. 1%
AB. 2%
AC. 3%
AD. 4%
AE. 10%
BC. 20%

Finally…

To finish this test, please enter your details below…